No products in the cart.
What is DevTool in Browsers?
Developer tools or DevTools are a set of utilities built into every web browser to help developers inspect, debug, and optimize their source code. They are essential for web development and can also be useful for mobile app development. Knowing about how to use a Browser DevTool in any browser that you use is essential for a JavaScript Developer.
DevTools in Popular Browsers
- Chrome DevTools is built into the Google Chrome browser.
- The web development tool that is embedded in Mozilla Firefox is Firebug.
- Similary for Apple Platforms, Web Inspector is the DevTool for the Safari browser.
Knowing about any one of these Browser DevTools will be sufficient. And we will be exploring more about Google Chrome’s DevTool features.
Accessing Google Chrome’s DevTool
Right-click on a webpage and select “Inspect”
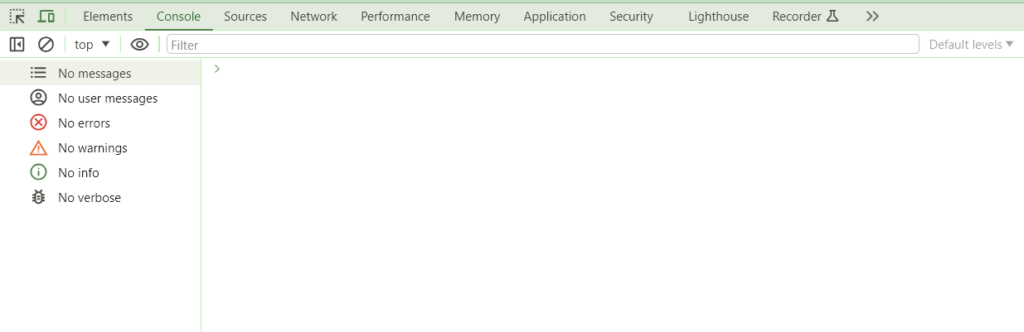
This is how the google chrome’s devtool looks like.
or
PressCtrl+Shift+I(in Windows/Linux)
So, DevTool is a part or fragment of a browser and each tab offers certain features that can be used to dive into a web page on a browser.
- Elements: Inspect and modify HTML and CSS.
- Console: View log messages and run JavaScript code.
- Network: Monitor network requests and responses.
- Sources: Debug JavaScript with breakpoints and watch variables.
- Performance: Analyze and optimize page performance.
- Memory: Find memory leaks and analyze memory usage.
- Application: Manage cookies, local storage, and other resources.
Features of Chrome’s DevTool
1. Inspecting Elements:
- Right-click on any part of the webpage and choose “Inspect” to see the HTML and CSS associated with that element. You can modify styles and see changes in real time.
2. Using the Console:
- Open the Console tab to see log messages (e.g., errors, warnings). You can also run JavaScript commands directly in the console.
3. Monitoring Network Activity:
- The Network tab shows all network requests (e.g., images, scripts) made by the webpage. This helps in analyzing load times and debugging issues with resources.
4.Debugging JavaScript:
- Use breakpoints in the Sources or Debugger tab to pause code execution and inspect variable values, call stacks, and more.
5. Analyzing Performance:
- The Performance tab records a session of your webpage to analyze load times, script execution, and rendering processes.
6. Managing Storage:
- The Application or Storage tab helps you view and manage data stored in cookies, local storage, and session storage.
Experiment Further
- Learn this Shortcut: Familiarize yourself with keyboard shortcut for quick access to tools (e.g., Ctrl+Shift+I to open DevTools) because it will be used frequently to check logs and debug your code.
- Modify Design by altering CSS code: Developer tools are cool to experiment with. You can modify HTML/CSS and JavaScript to see how changes affect the page.
- Explore Extensions: Consider adding extensions or plugins to your DevTool for additional functionalites and capabilities. For e.g. Lighthouse is a great plugin to get insights into the Performance of your Website. It provides a score and grade along with detailed analysis of what’s affecting the performance of a web page.
- Learn Debugging: Practice using breakpoints to pause and trace the execution of the program. Learn how to inspect network requests to see the used resources, services or APIs that are consumed by a web application.